
Quickly visualizing MySQL data
I constantly find myself digging through some of our raw data here at Mate1 looking for patterns or trying to figure out why we are seeing new ones. I usually sift through logs as well as user data and I join between a few tables. After I get most of my data I’ll apply transformations on the data, I group it, I compute aggregates, etc. At the end of this I’m usually greeted with MySQL’s usual tabular format which although is quite useful at times is also not the best format for showing trends and distributions. Most of this work that I’m doing is very adhoc and is not worth having any of the analytic team spend any amount of time on.
A while back I saw an interesting blog post show up in my RSS feed from Avery about afterquery. Afterquery is pretty damn cool. It pulls JSON data over JSONP from an HTTP server and allows you to apply transforms on it before either showing it as a table or graphing it. I thought to myself I’d love to be able to make use of this tool somehow when I needed to visualize some of my MySQL queries. I’d need a way to easily transform MySQL’s results into JSONP…
I didn’t think much about this until last night when I needed to visualize the amount of billing transactions with a certain inconsistent state over time because Wendy, Felix, and myself were wondering why we had some Hive queries taking a long time (turns out they’re running over invalid transactions and confusing the entire query). I ended up pulling the data from MySQL as CSV into Google Doc’s as a spread sheet and drew a quick graph from it. I’m sure there are ways to do this however I had none at my disposal and I don’t run Windows/Excel or any tools similar to that. I tried running Excel in a virtual machine for a while, that didn’t last too long.
After some googling around I turned up an application I’d seen a few years ago, dbslayer. dbslayer was put together by the NewYork Times as an HTTP server written in C that connects to MySQL and serves query results as JSON. I figured I could get this thing running and modify it so it can create JSONP instead of the JSON object it returned. After a bit of hacking I got it successfully returning JSONP the way afterquery expects it. It works something like this:
http://dbslayer/?query=select * from table limit 10
I had never tried using activequery before that point so I downloaded the sources and got it running locally. I then opened it up in my browser and pointed it at my dbslayer server. The URL bar had something like this:
http://afterquery/?url=http://dbslayer/?query=select * from table limit 10
When I let that URL go through I saw activequery’s access logs update followed by dbslayer’s debugging logs on the console and finally saw the data render into a table in the browser. Bingo! That meant I could quickly and easily pull out any data from MySQL, pre-process it in MySQL if needed, use activequery to process it after MySQL and render it in my web browser in a slick and expressive way. Now we’re getting somewhere…
After I got this working I started playing around with different queries and afterquery transforms. I got a series of interesting queries visualized as pie charts, bar graphs, line graphs, stacked graphs, and tree graphs. This stuff was seriously useful, and, quite easy to get the hang of. One of the annoyances I ran into though was that every time I changed the textarea that contained the afterquery query and transforms it’d refetch the data from dbslayer and in turn from MySQL, even if my SQL query did not change. This meant that simply changing activequery side options triggered a full data querying and delivery all over again each time.
That wasn’t very acceptable if this thing was going to use any shared resources or pull in any fair amount of data (fair… well, a few hundred megs or so…). The first thing I though of doing was implementing some kind of cache in dbslayer because I thought I’d not want to change afterquery (yes, I’d rather change C than JS… I’m old…). I cracked open the source code again and started adding a quick in-memory hash to hold MySQL’s query results. After a bit of hacking I decided to scrap that altogether. dbslayer worked but I was not going to be making any serious changes to it. Writing in C takes longer and this is not meant to be any “serious” project so… I rewrote dbslayer in Scala on top of Akka Actors for concurrency, Netty for the HTTP layer, and implemented a simple in-memory cache for MySQL’s queries. I called this JsonDB. It needs some work at the time of this writing for it to be useful to anyone but myself (I promise to try).
So now we had the ability to goof around in afterquery without terrorizing MySQL with every little change we make - excellent. At this point I decided to pull a bigger data set since I did not have to worry about hitting the database with every little change… After the data streamed into the browser I started making changes to it. Pulling the data from JsonDB every time helped but it was still slower that I wanted it to be. Again I found myself in one of those unacceptable situations. I cracked my fingers, ignored my wrist, and wrote a bit more code, this time around, in afterquery.
I opened up afterquery and looked around the source code and managed to find my way around it relatively easily. I started by making the UI less reactive to textarea changes and forced the user to press the an udpate button to reload the graph with the new parameters. The next change I made was in afterquery’s data fetching phase of its processing pipeline. I allowed it to cache the results it fetched from JsonDB, again for that query, so it does not have to go out across the network if it does not need to. I then loaded up that mean query, waited, it rendered. I refreshed the page, the same thing happened, I saw the cache hit on JsonDB. I made a change to the afterquery filter and hit update, no networks requests went out in the network inspector, JsonDB was silent, and Chrome’s CPU usage rose up while it re-processed the data and re-rendered the tables and graph. Another Bingo! I now was able to do what I had wanted to be able to do from the start. The only hiccup I noticed at the moment is with extract_regexp. This allows you to transform the value of the data in afterquery using a regular expression. This mutates the cached data which means that the same query can not run twice on the client. If you temporarily remove that transform after you’ve run the query the first time it works. I’ll have to make this work somehow.
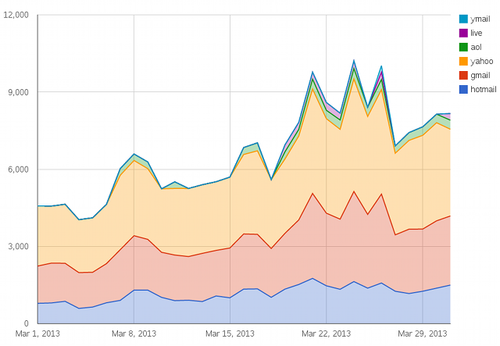
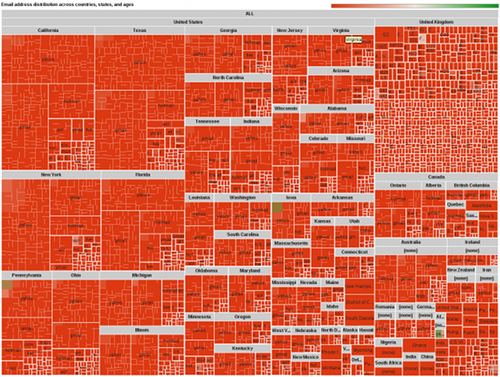
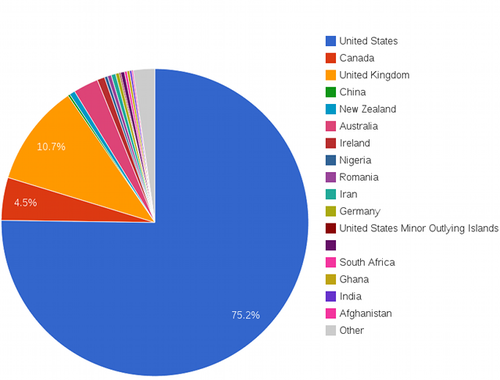
This is how some of the graphs look like…
I’m going to hack a bit more at both afterquery anf JsonDB to fix quirks smooth out rough edges then seriously consider building some dashboards at work with them. Visualizing small sized data in MySQL is a ton easier for me now, and its fun with afterquery’s transforms. You can find the sources here:
- https://github.com/mardambey/afterquery
- https://github.com/mardambey/jsondb